Goods Movement Statistics
The Goods Movement Statistics report allows collecting statistics on the purchase, production, or sale of goods for previous repeating intervals to determine average indicators. This will further allow planning purchases or production based on accumulated data. This report also allows monitoring changes in average indicators to identify trends and take timely measures to eliminate negative trends.
The Goods Movement Statistics report is built on the basis of primary documents (delivery notes, internal transfers, set assemblies ("complectations"), etc.). It is based on the Goods Movement report. Goods items that had no movement for the department in any interval will not be included in the report.
The report uses the term "Sliding Average Quantity" for analysis — the average value of the receipt/expenditure quantity for the previous intervals, including the current one. This value can be called the speed of receipts, expenditures (production, sales). A change in the value of the sliding average shows a change in the speed of receipts, expenditures (production, sales).
Goods Movement Statistics - Filter
Filter for the Goods Movement Statistics report: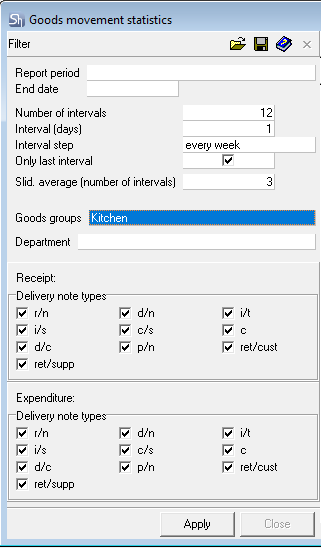
End Date — the date up to which documents from goods movement will be analyzed.
Number of Intervals — how many intervals "into the past" to analyze for report generation.
Interval (days) — how many days from each interval to analyze for report generation.
Interval Step — defines the frequency (distance) of the interval — week, month, year.
The fields "End Date", "Number of Intervals", "Interval (days)", "Interval Step" determine how to build the array of intervals for the report.
From the end date (field "End Date") in reverse order (into the past), N intervals (field "Number of Intervals") are counted. The field "Interval (days)" indicates the number of days in each interval.
Example of determining intervals from the filter
It is necessary to conduct an analysis as of 14.10.2018 (Sun). Use data on delivery notes for 5 weeks back in the analysis and analyze 3 days from each interval. Interval step is week.
Interval (days) determines which days of the week from "End Date" to analyze. When analyzing from Sun, 3 days back — that is Fri, Sat, Sun.
Thus, we get an array of intervals for building the report.
14.09.2018 (Fri) – 16.09.2018 (Sun)
21.09.2018 (Fri) – 23.09.2018 (Sun)
28.09.2018 (Fri) – 30.09.2018 (Sun)
05.10.2018 (Fri) – 07.10.2018 (Sun)
12.10.2018 (Fri) – 14.10.2018 (Sun)
To select specific days of the week for the report, it is necessary to set the "End Date" - the last day of the week from the interval required for analysis. And in the field "Interval (days)" specify the required number of days back.
Only Last Interval — when this flag is set, only the last interval from the array defined above will be displayed in the report. Cumulative data will use statistics from all intervals of the array.
Slid. average (number of intervals) — over how many previous intervals (including the current one) to calculate the average value of Receipt (Expenditure) Quantity for each interval.
Example of Defining Slid. average (number of intervals) from the filter
Array of Intervals: 14.09.2018 – 16.09.2018; 21.09.2018 – 23.09.2018; 28.09.2018– 30.09.2018; 05.10.2018 – 07.10.2018; 12.10.2018 – 14.10.2018.
Slid. average (number of intervals) = 2
For the interval 14.09.2018 — 16.09.2018, the average value of Number will be calculated from intervals 14.09.2018 — 16.09.2018 — current and 07.09.2018 — 09.09.2018 — previous. For the interval 21.09.2018 — 23.09.2018, the average value of Number will be calculated from intervals 21.09.2018 — 23.09.2018 — current and 14.09.2018 — 16.09.2018 — previous. And so on.
Goods Groups — in this field, you can select the goods group for whose goods items the analysis will be conducted in the report. If you selected a group containing subgroups, the report will be built including the subgroups nested within the specified goods group.
Department — select the department for whose delivery notes the report will be generated. In this field, only one department for analysis can be selected.
Receipt — define for the receipt parts of which delivery notes the report will be generated. Delivery note (expenditure) and return to supplier in this case will not participate in the analysis, even if the flags are set.
For example, to analyze the production of semi-finished products, it is mandatory to select set assembly ("complectation"), but you can also add internal transfer, processing acts, and surpluses from reconciliation statements to the analysis.
Expenditure — define for the expenditure parts of which delivery notes the report will be generated. Receipt note and return from customer in this case will not participate in the analysis, even if the flags are set.
After filling the filter, to generate the report, press the [Apply] button.
Goods Movement Statistics - Content
Goods Movement Statistics report according to the filter: 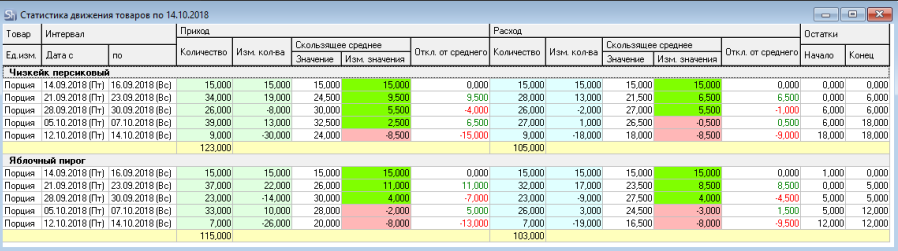
The report displays information on the supply and sale of desserts for the department "Bar Restaurant 1".
The report is grouped by the name of goods items.
UOM — base unit of measurement of the goods item, in which quantitative values are indicated in the report.
Interval From... To — start and end date (and days of the week) for which the report values are shown.
Receipt
Quantity — total quantity of the goods item that was received in the time interval (fields "Interval From , To"), to the department defined in the report filter by documents whose types are defined in the report filter in the fields "Receipt, Types of Delivery Notes".
Quantity Change — the difference between the value of the "Quantity" field and the value of the "Quantity" field from the previous interval, which shows how much the quantity of receipt of the goods item has changed.
Sliding Average/Value — the average value of the "Quantity" field, of the current and previous N-1 intervals, where N is the value of the "Slid. average (number of intervals)" field of the report filter.
An indicator that can be used in logistics as the planned quantity of the goods item that needs to be purchased or produced.
Sliding Average/Value Change — the difference between the value of the "Sliding Average/Value" field from the current and previous interval, shows how much the average value of the receipt of the goods item has changed.
The value "Sliding Average/Value Change" shows the direction of the trend. If the value is positive, then the trend is upward (green color), if negative, then the trend is downward (red color).
Deviation from Average — the difference between the value of the "Quantity" field and "Sliding Average/Value". If positive, then possibly overstocking or overproduction. If negative, then underproduction.
Expenditure
Quantity — total quantity of the goods item that was expended in the time interval (fields "Interval From , To"), from the department defined in the report filter, by documents whose types are defined in the report filter in the fields "Expenditure, Types of Delivery Notes".
Quantity Change — the difference between the value of the "Quantity" field and the value of the "Quantity" field from the previous interval. Shows how much the quantity of expenditure of the goods item has changed.
Sliding Average /Value — the average value of the "Quantity" field, of the current and previous N-1 intervals, where N is the value of the "Slid. average (number of intervals)" field of the report filter. Shows planned sales or expenditure of raw materials.
Sliding Average/Value Change — the difference between the value of the "Sliding Average/Value" field from the current and previous interval. Shows how much the average value of expenditure of the goods item has changed.
The value "Sliding Average/Value Change" shows the direction of the trend. If the value is positive, then the trend is upward (green color), if negative, then the trend is downward (red color).
Deviation from Average — the difference between the value of the "Quantity" field and "Sliding Average /Value". If the deviation is positive — the goods item is being used faster than the reference expenditure rate. If the deviation is negative, then the expenditure is slow, possibly overstocking.
Balances (Beginning/ End) — stock of the goods item in the report units of measurement at the beginning and at the end of the interval.