Sales by Days
The Sales by Days report contains grouped information on sales amounts by day. The report is built based on Requests without product analytics. The report contains only the amounts of filtered and grouped external requests.
Sales by Days - Filter
The filter for the Sales by Days report:
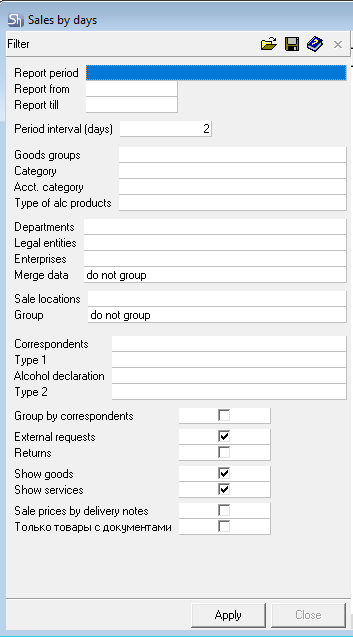
The filter parameters "Report from ... to...", "Departments", "Legal Entities", "Enterprises", "Goods Groups", "Correspondents", "Report Currency" are filled in using standard methods.
Additional filter fields:
Sale locations – in this field, you can select the points of sale whose requests will be used to generate the report.
Group By – if necessary, select the method for grouping the report data output in this field: Do Not Group or By Sale locations.
Group by Correspondents – check this box if the report needs to be grouped by correspondents.
External Requests/Returns – use the flags to define for which type of requests the report should be generated. Setting one of the flags is mandatory.
Show Goods/Show Services – use the flags to define which type of goods should form the amounts for the report. Setting one of the flags is mandatory.
Sale prices by delivery notes – when this flag is set, sales amounts will be taken from the expense/receipt delivery notes created based on the requests, not from the requests themselves. This may lead to discrepancies between the data in the requests and the report if "write-off at cost" was used.
After filling out the filter, to generate the Sales by Days report, click the [Apply] button.
Sales by Days - Content
The Sales by Days report table with all groupings:
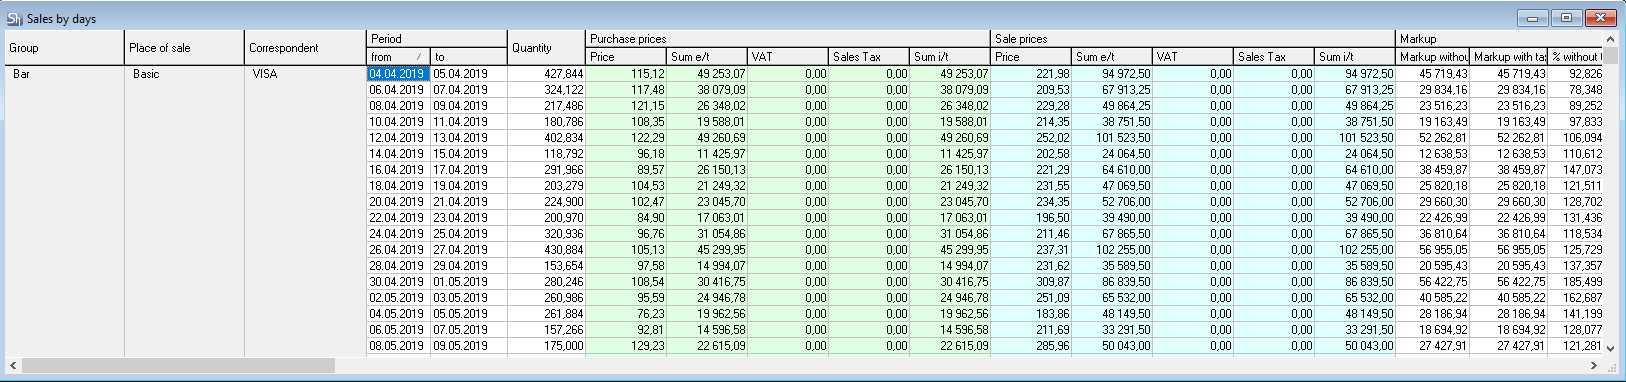
Groupings on the left:
Group – the selected grouping method in the filter based on your organization's details (Department or Enterprise or Legal Entity).
Sale locations – if the "by sale locations" grouping is set in the filter.
Correspondent – if the "by correspondents" grouping is set in the filter.
Fields of the table:
Period from... to... – this field displays a period equal to 1 step set in the filter (step 1 day).
Quantity – this field displays the total quantity of sold goods/services for the step period.
Purchase Amounts – the following values are displayed in this section of the table header:
Price – average purchase price of sold goods for the step period;
Sum e/t – total purchase amount excluding taxes of sold goods for the step period;
VAT – total amount of purchase value-added tax of sold goods for the step period;
Sales Tax – total amount of purchase sales tax of sold goods for the step period;
Sum i/t – total purchase amount including taxes of sold goods for the step period.
Sale Amounts – the following values are displayed in this section of the table header:
Price – average sales price of sold goods/services for the step period;
Sum e/t – total sales amount excluding taxes of sold goods/services for the step period;
VAT – total amount of sales value-added tax of sold goods/services for the step period;
Sales Tax – total amount of sales sales tax of sold goods/services for the step period;
Sum i/t – total sales amount including taxes of sold goods/services for the step period.
Markup – the following values are displayed in this section of the table header:
Markup e/t – total markup amount on the purchase price excluding taxes;
Markup i/t – total markup amount on the purchase price including taxes;
% e/t – markup percentage on the purchase price excluding taxes;
% i/t – markup percentage on the purchase price including taxes;
(Pur/Sale)% e/t – ratio of purchase and sales prices as a percentage excluding taxes;
(Pur/Sale)% i/t – ratio of purchase and sales prices as a percentage including taxes.
Returns in the "Sales by Days" report are displayed with negative values, as these amounts must be subtracted from the sales amount. If both sales and returns fall within a step according to the specified filter, the report will display the sum (taking into account the sign) of all requests.