Step Movement of Goods
The report is a flexible tool that allows you to evaluate total goods flows, the dynamics of their changes, the production and sale of semi-finished products and dishes, analyze inventory, with the ability to break down the report generation period into intervals (repeating periods). In the context of intervals, it is possible to analyze all types of documents according to the options pre-selected in the report filter. Also, in the report filter, you can specify a goods group or category of goods, define a department (departments), enterprise or legal entity, correspondents of receipt or sale. Thus, the extended functionality of the filter allows generating reports for different analysis purposes and controlling all stages of production, receipt, and expenditure.
The report form contains areas: Receipt, Expenditure, Expenditure - sale amounts and Markup.
For each goods item in the Step Movement of Goods, the Goods Movement report can be invoked. To do this, call the context menu from the row with the desired goods item and select the command Goods Movement.
Step Movement of Goods - Filter
The filter for the Step Movement of Goods report is shown in the screenshot:

Parameters of the report filter Report From..., Departments, Legal Entities, Enterprises, Goods Groups, Category, Acct. Category, Type of Alc. Products, Correspondents-Suppliers, Correspondents-Recipients, Correspondent Attributes, Report Currency are filled using standard methods.
Additional filter fields:
Number of Steps (1-31) — how many intervals from the start date (Report From...) to analyze for report generation; a numerical value from 1 to 31 must be entered.
Step Size — defines the frequency (distance) of intervals — week, month, quarter, year; it is also possible to specify a numerical value.
Calculation Interval ("Estimated Interval") — how many days (specified manually as a number of days) from each interval to analyze for report generation, or you can select an interval from the dropdown list: week, month, quarter, year.
The fields Report From..., Number of Steps (1-31), Step Size, Calculation Interval ("Estimated Interval") determine how to build the array of intervals for the report.
If Step Size is less in value than Calculation Interval ("Estimated Interval"), then the size of the report interval and step will be equal to the value from the Step Size field.
Example of defining intervals from the filter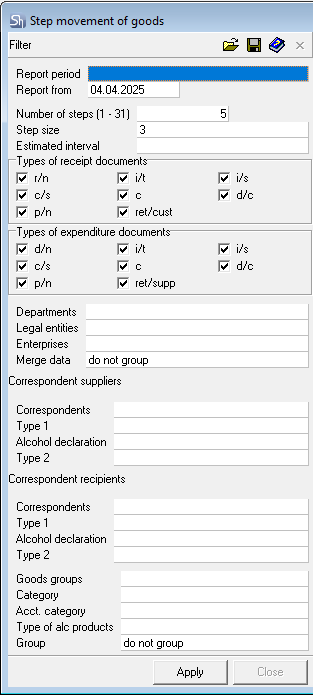
It is necessary to conduct an analysis from 01.01.2022, use data on delivery notes for 6 months ahead in the analysis, and analyze the first 3 days of each step.
To solve this task, specify in the filter:
Number of Steps — 6 (number of months ahead from the report start date)
Step Size — select month
Calculation Interval ("Estimated Interval") — 3 (number of days in the interval).
Thus, we get an array of intervals for building the report.
- 01.01.2022-03.01.2022
- 01.02.2022-03.02.2022
- 01.03.2022-03.03.2022
- 01.04.2022-03.04.2022
- 01.05.2022-03.05.2022
- 01.06.2022-03.06.2022.
If it is necessary to conduct an analysis for specific days of the week, then in Step Size you must select Week, and in Calculation Interval ("Estimated Interval") — a number of days not more than 7.
For example, you need to analyze Saturdays and Sundays in January 2022.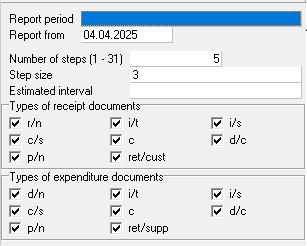
Report From... — the first Saturday of the month, Number of Steps — the number of weekends in the month, Step Size — the step to analyze, Calculation Interval ("Estimated Interval") — the number of days in the step.
Array of report intervals: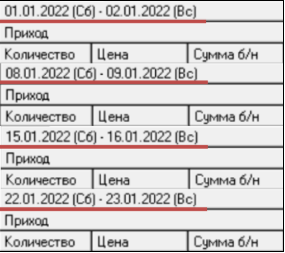
Step Movement of Goods - Content
The Step Movement of Goods report is shown below: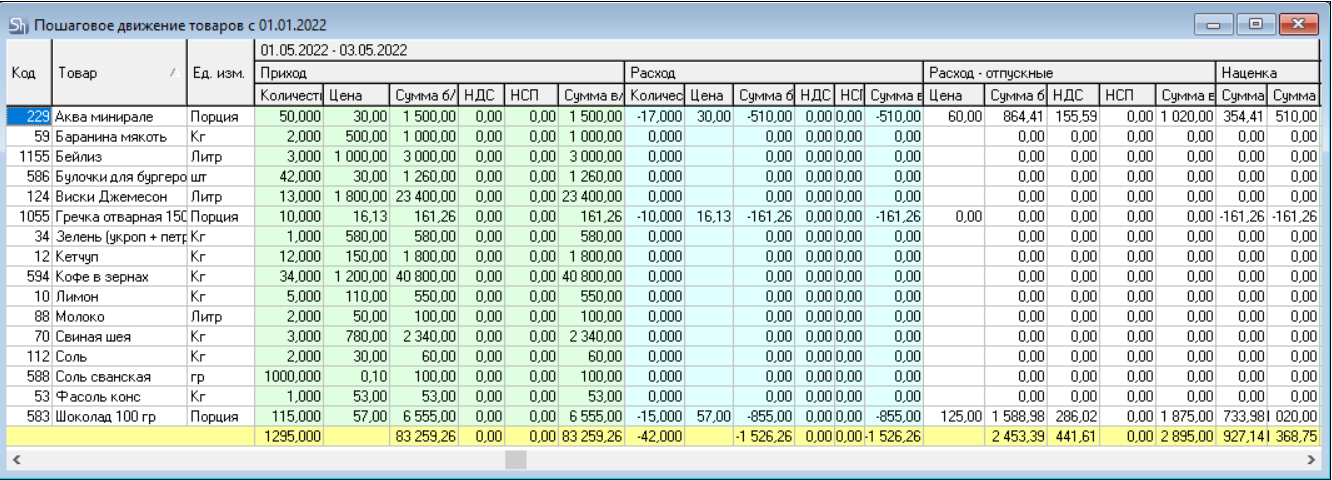
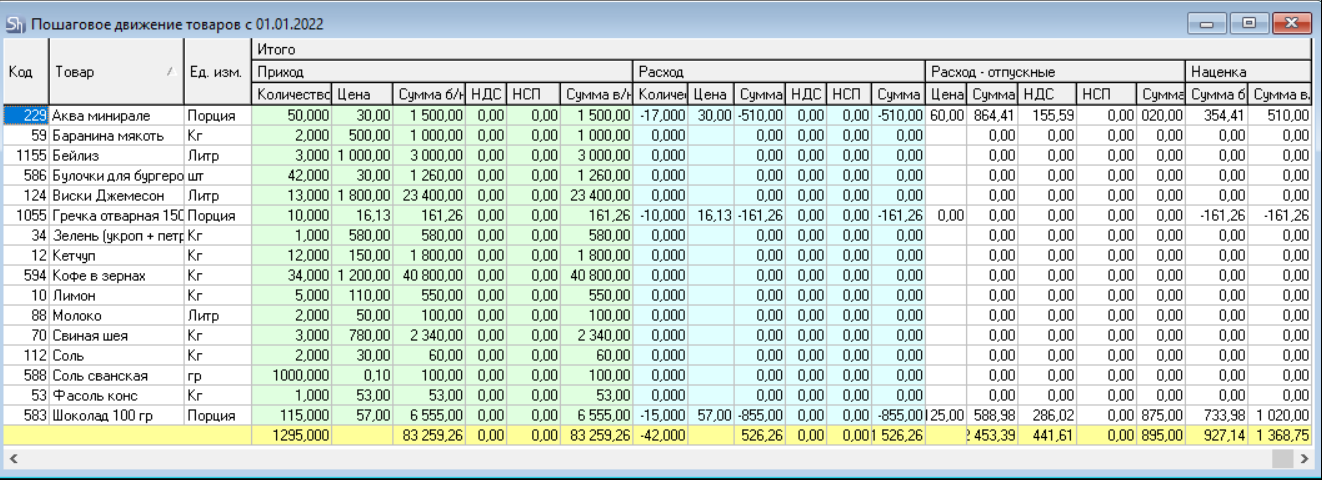
In each row of the table, data for a separate goods item is displayed. In each area of the table header, aggregated data for this goods item for the corresponding document type, selected in the filter for a specific interval, are displayed. In the upper part of the table header, the array of intervals, predefined in the filter, is indicated.
Code — this field displays the code of the goods item.
Goods — this field displays the name of the goods item.
UOM — contains the name of that unit of measurement of the goods item for which the Report flag was set in the product card on the Units of Measurement tab.
The Receipt area of the table contains the following values:
Quantity — total quantity of the goods item that was received in the time interval specified above to the department defined in the report filter by documents whose types are defined in the report filter in the fields Types of Receipt Documents.
Price — price of the received goods item;
Sum e/t — amount excluding taxes;
VAT — value-added tax;
Sales Tax — sales tax;
Sum i/t — amount, including taxes.
The Expenditure area of the table contains the following values:
Quantity — total quantity of the goods item that was expended in the time interval specified above from the department defined in the report filter by documents whose types are defined in the report filter in the fields Types of Expenditure Documents.
Price — price of the expended goods item;
Sum e/t — amount excluding taxes;
VAT — value-added tax;
Sales Tax — sales tax;
Sum i/t — amount, including taxes.
The Expenditure - sale amounts area of the table contains the following values:
Price — sale price of the goods item;
Sum e/t — amount excluding taxes;
VAT — value-added tax;
Sales Tax — sales tax;
Sum i/t — amount, including taxes.
The Markup area of the table contains the following values:
Sum e/t — amount of markup on the purchase price of the goods item excluding taxes;
Sum i/t — amount of markup on the purchase price of the goods item including taxes.
The Total section contains the areas Receipt, Expenditure, Expenditure - sale amounts and Markup, which display the total values for the entire array of intervals.
Configuring the form of the table presentation can be done arbitrarily, both before generating the report and after pressing the Apply button in the report filter.
Data on monetary amounts are displayed in the currency selected in the filter.