Based on the generated cube, various report formats can be created. The reports can be viewed in graphical form.
Window for working with a cube:
The following operations can be performed when working with the cube.
To edit the report layout in the Fast Report editor, use the  button on the toolbar. In the window that opens, use the Use system names flag to select whether system or user field names will be used in the report.
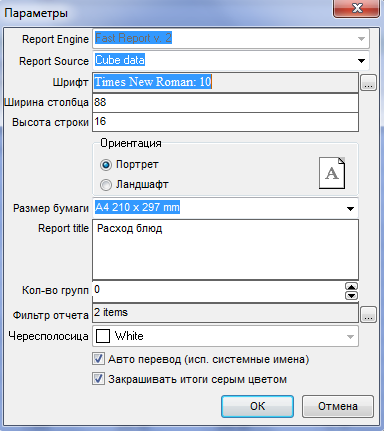
To set a date filter for a report, use the![]() button . To clear the date filter, use the
button . To clear the date filter, use the ![]() button.
button.
After generating the report, you can save it using the  button on the toolbar.
You can close a report without saving it using the  button on the toolbar (or using the Close without saving pop-up menu command).
Defining facts
Use the  button to open the list of facts.
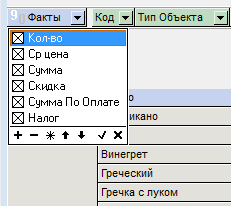
In the list, mark the facts (icon  to the left of the fact name) that should be visible in the report.
When working with a list of facts, you can use the following commands: - select all the facts;
 - deselect all facts;
 - reverse selection;
 - move a fact to the left in the fact list;
 - move a fact to the right in the list of facts;
 - exit the list while saving the list of selected facts;
 - exit the list without saving the list of selected facts.
It is necessary to define at least one fact to build a cube.
If multiple facts are checked, the fact names are displayed as column headings.
If one fact is selected for analysis, its name is not reflected in the table if there are horizontal axis dimensions.
If all facts are selected, the word "Facts" is written in normal font, if not all then in italics.

To display fact values as a percentage by row, use the toolbar key ![]() .
.
To display fact values as a percentage by column, use the toolbar key ![]() .
.
Defining dimension axes
You can drag dimensions from the unallocated axis to the vertical and horizontal axes. You can drag dimensions from the horizontal and vertical axes to the unallocated axis. You can also drag dimensions from the vertical axis to the horizontal axis and vice versa. Another use for dragging is to change the order of dimensions.
The dimension is green during dragging. The result of dragging at the end of the current moment is indicated by a change in the shape of the mouse cursor.
If no change in dimension position occurs, a small white circle divided in half is displayed.
If a dimension is moved as a result of dragging, a small white rectangle is displayed next to the cursor arrow.
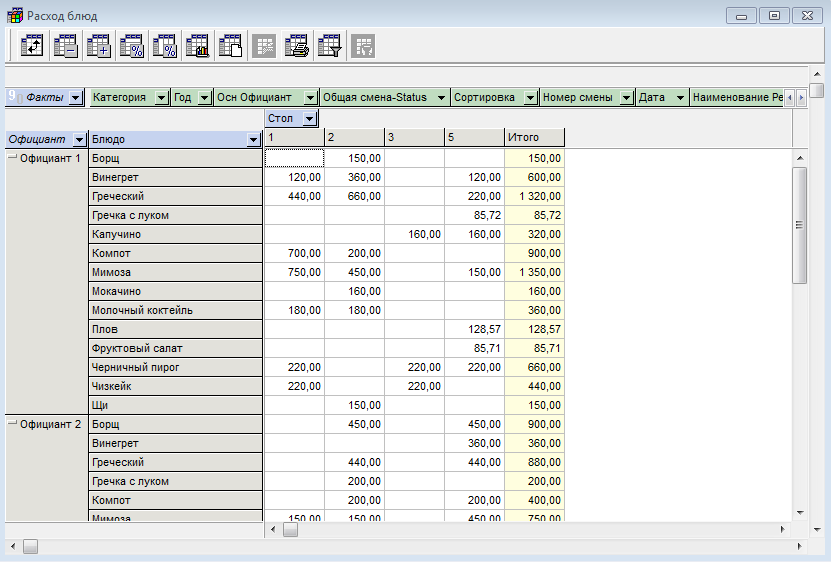
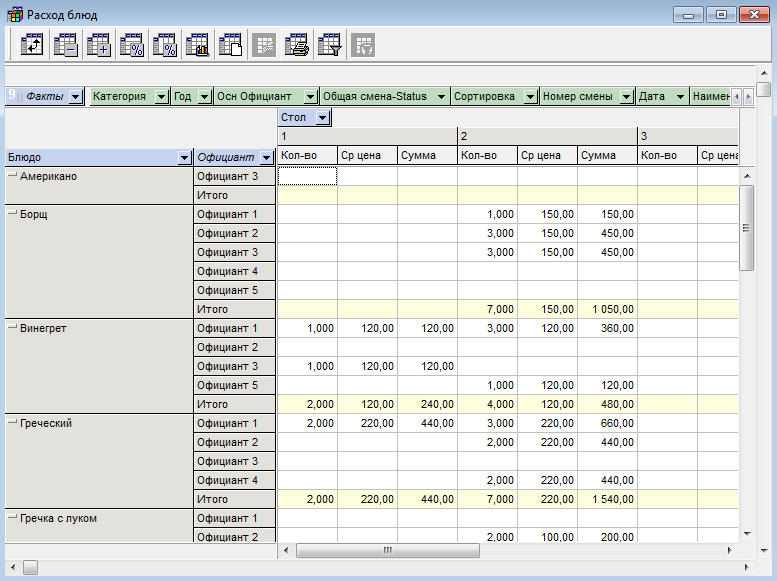
The figures show the same cube. The figures show how the information is displayed in the report depending on the order in which the dimensions are placed on the axis.
You can rotate the table by swapping the axes. To do this, open the pop-up menu in the cube window and use the Swap command (or the button ![]() on the toolbar).
on the toolbar).
The display of dimension values can be complete or selective. To define a list of dimension values, select them from the list, similar to selecting from a fact list.
If all values of a dimension are selected, its name is displayed in normal font; if not all, it is displayed in italics.
If several dimensions are displayed on an axis, then at any level it is possible to display summary information without dividing into sublevels.
"Collapsed" dimension
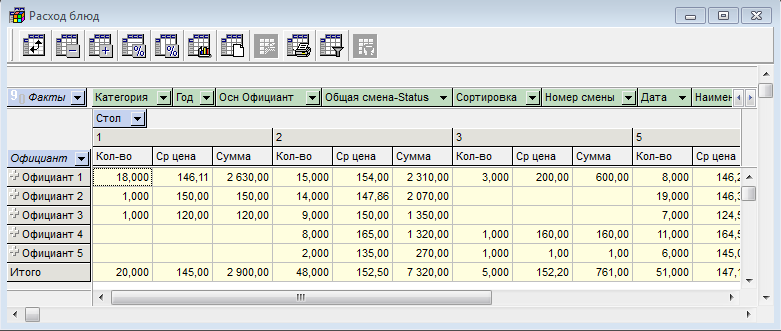
To collapse an "expanded" dimension, click on the sign  to the left of the dimension name or use the Collapse Dimension command from the pop-up menu called from the dimension name area.
To collapse all dimensions at once, click the button ![]() on the toolbar (or use the Collapse command from the pop-up menu called from the cube window area (excluding the dimension name area).
on the toolbar (or use the Collapse command from the pop-up menu called from the cube window area (excluding the dimension name area).
To expand a "collapsed" dimension, click the sign  to the left of the dimension name or use the Expand Dimension command of the pop-up menu called from the dimension name area. To expand all dimensions at once, click the button
 ![]() on the toolbar (or use the Expand command of the pop-up menu called from the cube window area).
on the toolbar (or use the Expand command of the pop-up menu called from the cube window area).
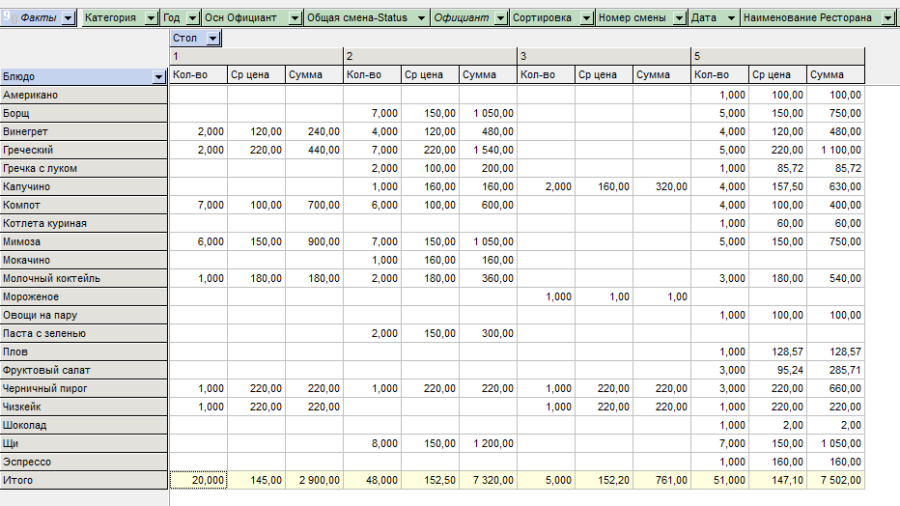
Displaying totals
For any dimension, it is possible to automatically calculate totals (by rows or columns). To do this, call the pop-up menu from the dimension name area and use the command Totals on/off.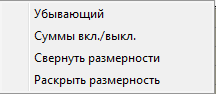
The totals display mode can be enabled for any number of measurements. Totals are displayed on a pale yellow background.
Printing report
The report received on the screen can be printed.
To print a report, press the button ![]() on the toolbar. A window with preset layout parameters for printing on A4 paper will be displayed on the screen.
on the toolbar. A window with preset layout parameters for printing on A4 paper will be displayed on the screen.
Fields for specifying report parameters:
Report Engine – the report designer used;
Report Source – report source: "Cube data" or "SQL query";
Font – report font;
Column width – report column width;
Row height – height of the report row;
Orientation – vertical (“Portrait”) or horizontal (“Landscape”);
Paper size – the size of the paper used for printing;
Report Title – title of the report;
Number of groups – the number of report groups.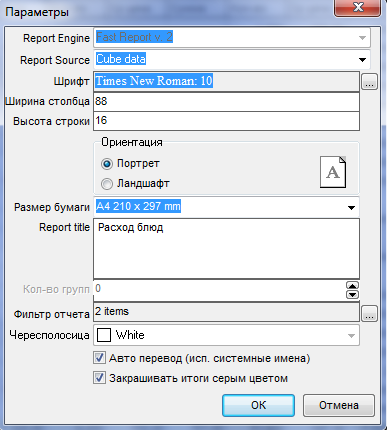
Report filter — fields that will be displayed in the report filter when it is opened from the Reports main menu item. For example, if you select three fields in the filter, as shown in the figure on the left, the filter will be as shown in the figure on the right.
The standard filter includes the Restaurant and Date fields.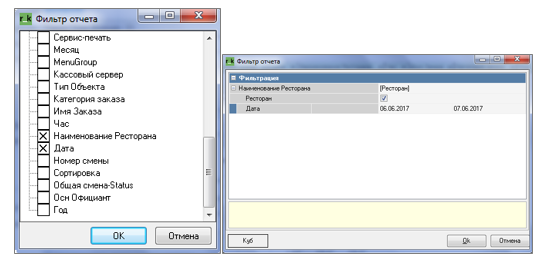
To confirm the preset settings, click "OK". The preview window will be displayed on the screen.
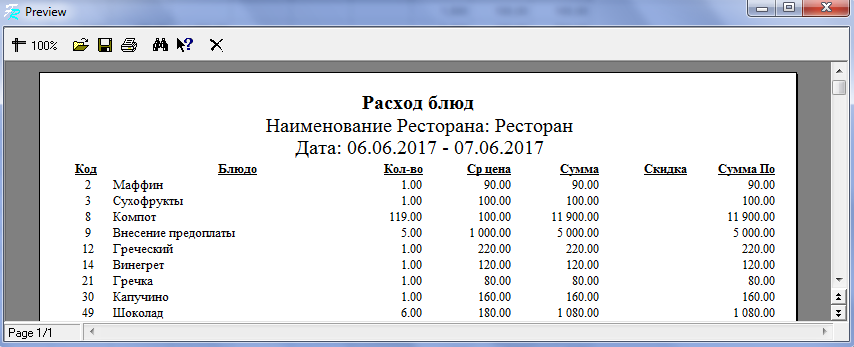
To print the report, use the button  on the toolbar. The button
  is used to change the scale of the layout view. Using the button
  , you can open another report (file with the .frp extension) for viewing. If changes have been made to the layout, you can save them using the button
  . The button
  searches for text fragments. The button
  closes the viewing window.
Export to other applications
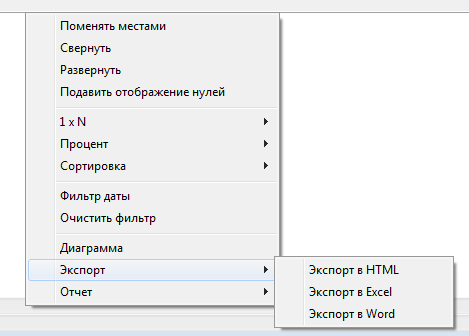
The data displayed in the cube can be exported to MS Excel, MS Word and HTML. To do this, use the Export command of the pop-up menu called from the cube window area (excluding the dimension name areas).
Graphical representation of the report
The application has the ability to present a report in the form of various types of diagrams. To call the window for working with diagrams, click the button ![]() on the toolbar or use the Diagrams item of the pop-up menu called from the report table area.
on the toolbar or use the Diagrams item of the pop-up menu called from the report table area.
The following window will appear on the screen:
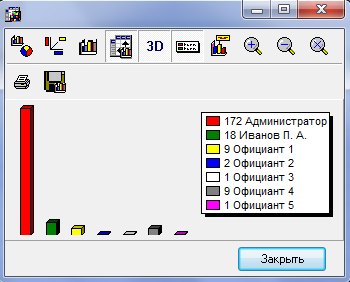
The chart presents data about the leftmost fact and the leftmost dimensions of the horizontal and/or vertical axes. - enabling/disabling the display mode on the data diagram taking into account their division into the values of the dimension of the opposite axis;
![]() - swap chart axes;
- swap chart axes;![]() - enable/disable 3D representation of the diagram;
- enable/disable 3D representation of the diagram; - enable/disable color decoding output;
![]() - enable/disable the display of dimension value markers along the vertical axis;
- enable/disable the display of dimension value markers along the vertical axis;![]() - increase the scale of the diagram;
- increase the scale of the diagram;![]() - reduce the scale of the diagram;
- reduce the scale of the diagram;![]() - return to the standard diagram presentation scale;
- return to the standard diagram presentation scale;![]() - print diagram;
- print diagram;![]() - save the diagram as a .bmp file.
- save the diagram as a .bmp file.
The window toolbar contains the following buttons:![]() - Selecting a chart type. When the Advanced flag is set, an additional set of chart parameters is displayed in the right pane of the window – specific for each chart type.
- Selecting a chart type. When the Advanced flag is set, an additional set of chart parameters is displayed in the right pane of the window – specific for each chart type.![]() - defining the diagram parameters. The following window appears on the screen:
- defining the diagram parameters. The following window appears on the screen: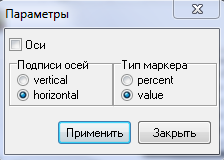
The Axis Labels radio button determines whether the labels on the horizontal axis are displayed vertically or horizontally. The Marker Type radio button determines whether the data is displayed as a number or as a percentage.
View receipt, order
It is possible to view the receipt and order from the report editor window.
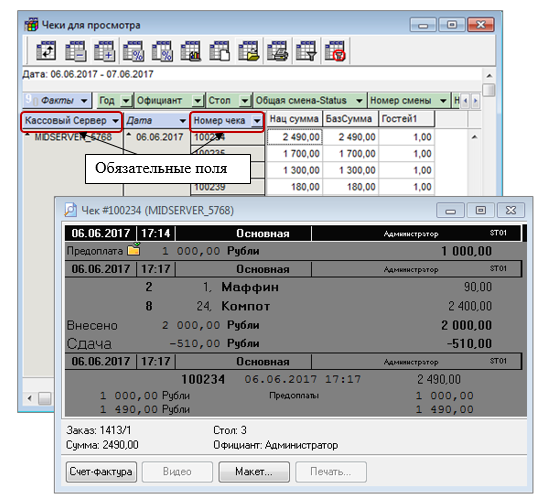
In order to implement this feature, the cube must contain the fields listed below after the numbers 1 or 2:
1. “Receipt – Receipt Number” and at the same time the “Cash Register Server – Network ID” field (or at the same time the “Closing Station” field).
2. “Order – Order Name”, and at the same time – the “Closing Station” field (or the “Cash Register Server – Network ID” field), number or date of the common shift.
In the report layout editor, place these fields on the vertical or horizontal dimension axis, and then double-click the right mouse button in the report data table area on the row containing the receipt or order whose contents you want to view.
To view the printable form and print the selected receipt, use the Print command at the bottom of the preview window. To view the invoice for the receipt, use the Invoice command.
- Example: Below is a report containing the required fields "Server" and "Check Number" and an order called up by double-clicking the left mouse button from the check line #100342.
Printing an invoice
Printing of invoices is possible using the Invoice module or without it – if the invoice was created at the cash register. In the latter case, the name of the Invoice operation is displayed in bold on the button.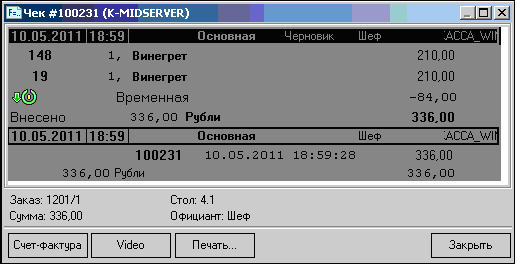 The "Invoice" command calls the Invoice module. If an invoice was created at the cash register for this receipt, the question is displayed: "There is already an invoice created at the cash register for this receipt. Do you want to print it?" If you answer "Yes", the invoice is printed according to the layout. If you answer "No", the Invoice module opens.