Configuring Integration with Grafana
Introduction
This article describes the integration between r_keeper 7 and the Grafana analytical application.
Grafana Installation
Grafana works with different systems — Linux, Windows, etc. The installation is trivial and is described in detail on the download page. Here, we consider an example of installation for Windows. A detailed description (in English) is available in the Grafana official documentation.
- Download the installer from the download page
- Launch the installer and wait for the process to complete
- In your browser, go to http://localhost:3000/login, or to the address of the server where the system is installed
- The login window should open

- If the window appeared, the installation is successful. Default login and password are admin / admin.
Grafana Configuration
- Download the file attached to the article
- In Grafana, in the left menu, click + and choose Import
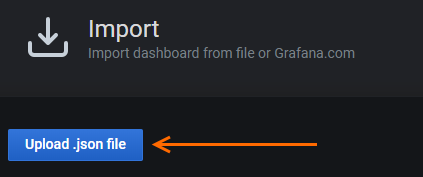
- Click Upload .json file
.
- Select the previously downloaded .json file
- In the Name field, specify the name for the newly created dashboard
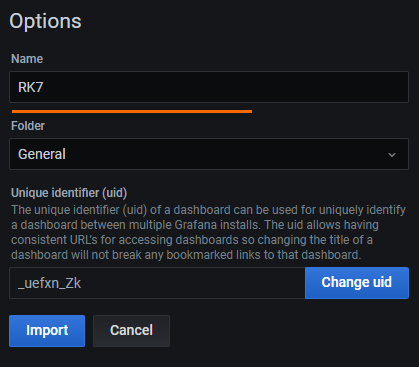
- Click Import
- The newly created dashboard will appear on the screen.
Installing Pie Chart Plugin
For the dishes pie chart to operate, an additional plugin is required.
If this plugin is not installed, the following error will appear instead of the chart:
The plugin can be installed via the command line.
- Launch the command line as an administrator.
- Navigate to Grafana installation path. Default path: cd "C:\Program Files\GrafanaLabs\grafana\"
- Go to the bin: cd bin folder.
Execute the following command:
.\grafana-cli.exe plugins install grafana-piechart-panelCODE- After the plugin is installed, you will see the following message:
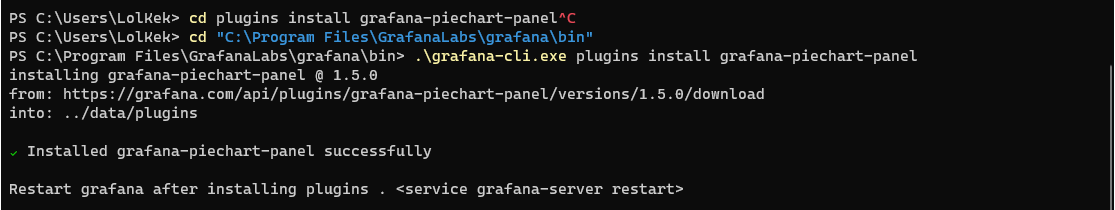
- Restart the Grafana server, and the pie charts will become functional.
Configuring Database Communication
For the dashboard to acquire data, a data source should be registered in the system.
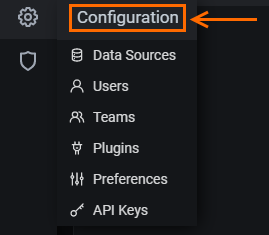
- Go to Configuration > Datasources
- Click Add data source

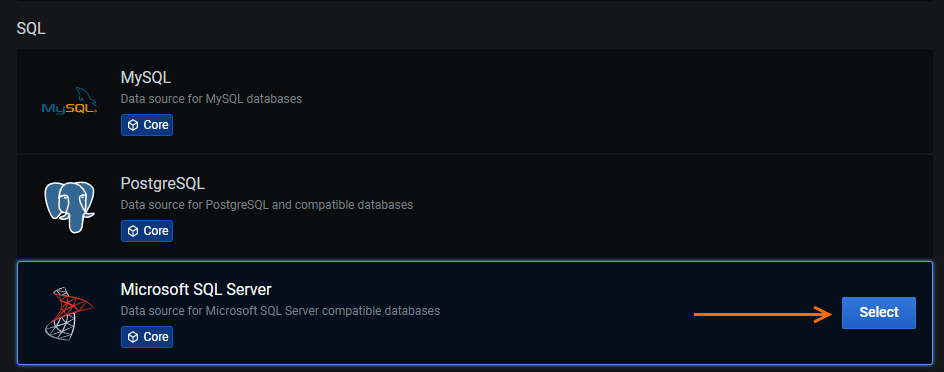
- In the SQL section, choose Microsoft SQL Server and click Select.
- Configure the MS SQL server connection. Fill in the following fields:
- Host — server IP address and port. You can specify the port after a colon.
- Database — r_keeper 7 database name
- User — database user. For Grafana, it is recommended to create a user with minimum database privileges — the SELECT execution permission will be sufficient
- Password — database user password
- Encrypt — encryption mode. It can take the following values: false – disabled, true – enabled.
- Do not forget to enable the Default setting, so that MS SQL would be the default data source
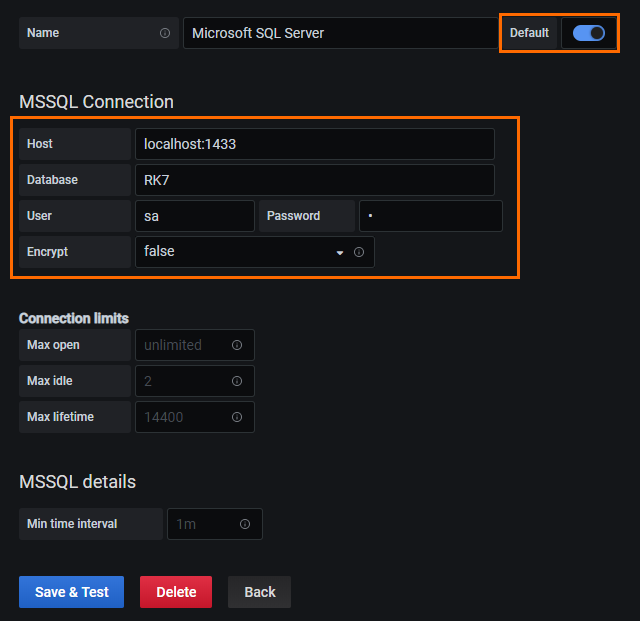
- Click Save & Test.
- The following message should appear: Database Connection OK. If not, check the MS SQL server connection settings.
Usage
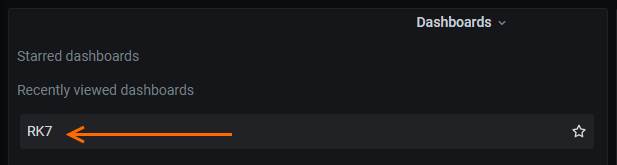
The configuration is complete. Now, you can see the charts. Go to the home page and find the previously created dashboard:
If the database contains relevant data, it will be displayed in the charts: 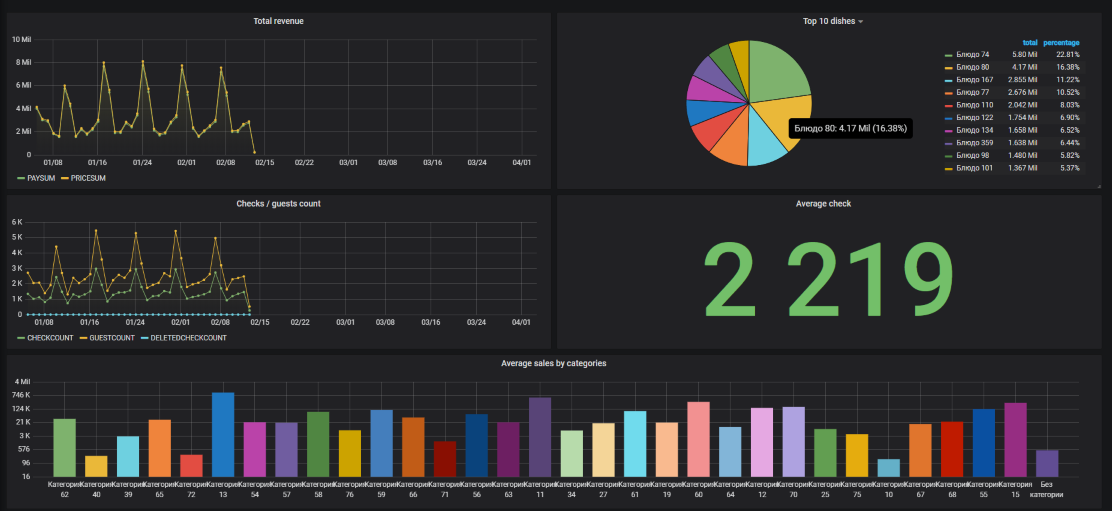
Now, Grafana is functioning. You can customize each chart in detail and change everything you need. A detailed configuration description is available in the official documentation.
Good luck!