The structure of the notification about connection errors to the systems of the new dashboard
Home page
A bar with a restaurant is displayed, each restaurant displays the systems that can be connected to it (Directory Server, Cash Server, SQL Database, StoreHouse5)
Example: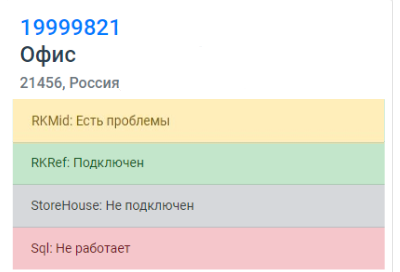
The connection to the system exists in the following states:
Connected: | Everything is ok | |
There are problems: | The restaurant has several systems (mids), one of which is connected and the other has problems. | |
Not connected: | There was no connection either never or for more than a week. | |
Doesn't work: |  | Doesn't work. Means that there was one for a week, but now there is not a single working system of this type. |
When you want to obtain details about a specific restaurant's connections or if there are issues (the bar turns red or yellow), clicking on the object code takes you to a page with detailed information about the connections. Clicking on a system will take you to an article with recommendations for fixing that particular system’s connection.
Example: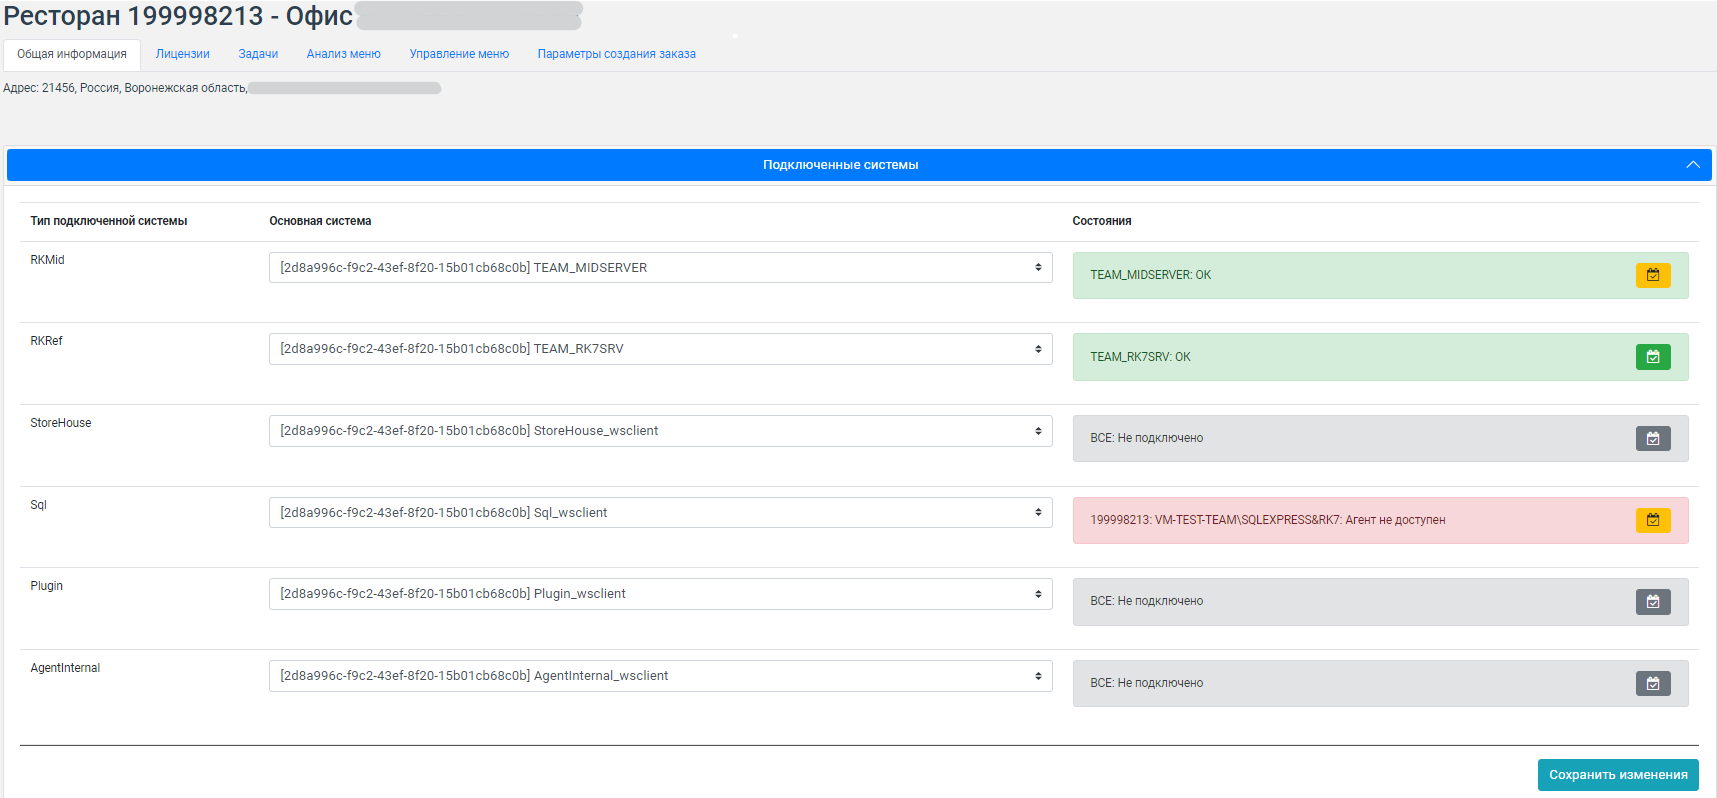
Connection status options:
Connected:

Status: Green (OK), Button is green - everything is fine
What to do: Nothing, everything is working normally.
Connected, but there are requests with errors:

Status: Green (OK), the button is yellow
(When you hover over the button, you will see which requests have errors. The requests will have timeouts. When you click on it, the Tasks tab will open with a filter on this error)
What to do: Pay attention. There may be a connection, but it is slow and a system restart is required.
- Restart the system to which the requests are addressed.
- Restart WSA
Examples:
- There are 2 mids, one is connected and the other is not.
In such a situation everything works ok, but you should monitor the settings. requests can go to a non-working mid
MID was previously connected, but getagentinfo is not working. This happens because requests are not going through, so we do not know the current status of MID and cannot provide either an error message or an accurate status.
Status: Green (OK), the button is red
(When you hover over the button, you will see which requests have errors. The requests will have errors. When you click on it, the Tasks tab will open with a filter on this error
- A large number of errors during execution.
What to do: In most cases, the connection is configured, but you need to pay attention to the settings (license, etc.).
First of all, click on the button and read the error text. In most cases, it describes what the problem might be. Link to the error description: Error Description
Examples:
- If createOrder - then the order creation parameters in the corresponding tab are not configured correctly
- If sql - then either a license, or you need to contact TS Plazius
- If SH5 - then either the license, or you need to try to restart.
Connection error:

Status: Red (Error)
When you hover over the button, you will see which requests have errors.
When you click on it, the Tasks tab will open with a filter on this error.
The button is green - there is no connection, there were no requests
Yellow button - requests will have timeouts
The button is red - requests will contain errors
What to do:
First of all, click on the button and read the error text. In most cases, it describes what the problem might be. Link to the error description: Error Description
Error types:
| Agent not available | There were requests and not a single agent... Either the agent is disabled (start), or there are problems with the connection |
| There is no agent with the role | In this case - there is an aggregator (external system. Reporting, delivery, etc.) trying to make requests to your restaurant, but you have never had a connected system with such a role. If there was no such system, then it is ok, do not pay attention. If you have such a system, check the connection settings. |
| Connection error | there were requests and errors were returned. Here you need to check the connection settings to "this system" (here we will indicate what kind of system it is in the articles for each one) |
After editing and launching the agent, the status turns green.
Not connected:

Status: Gray (No connections), the button is gray
This means that such a system has not been connected at all in the last 7 days.
What to do:
If you need a connection in a system of this type, set up the connection according to the instructions