Introduction
In general, an r_keeper document for printing consists of 2 components:
- A set of OLAP cubes (datasets)
- A document layout.
A set of cubes determines which sets of variables will be used used in the check layout. You may edit the layout to change the design of the future document.
The Documents and Layouts menu contains preset layouts. Preset check layouts cannot be edited, but their copies can be.
The layout used for printing is called the document view. The set of document views used in the work is called the Printing Scheme. Printing schemes can be created and edited.
Layout editor
Let's consider editing a layout using an example of a regular receipt.
To open the layout editor:
- In the manager station, go to Options > Printing > Documents and Layouts.
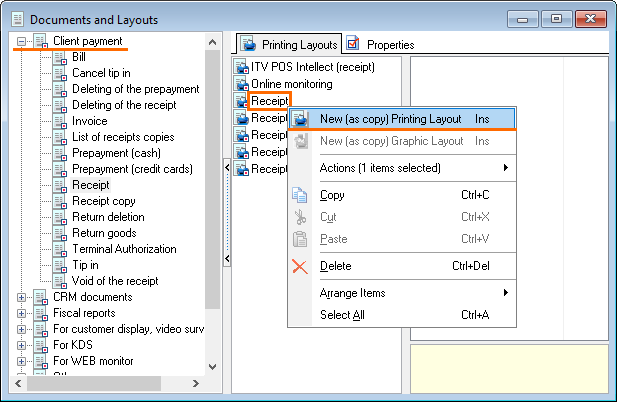
In our example, we will edit the receipt layout, but you may edit any other layout. - Go to the Client payment section. Right-click on the Receipt layout and select New (as copy) Printing Layout.
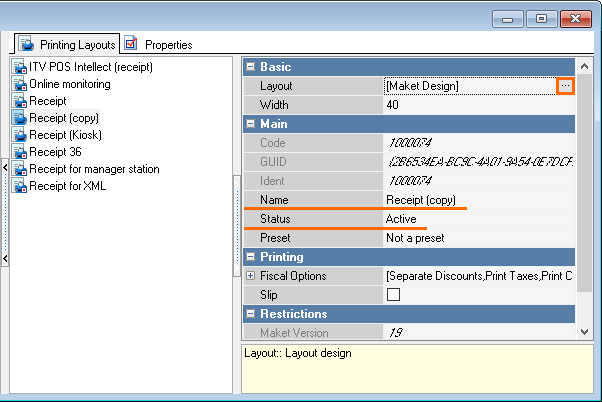
- Name the new layout and change the status to Active. Save the changes.
- In the Basic section, click on the Layout line, then on three dots

- The layout editor will open.
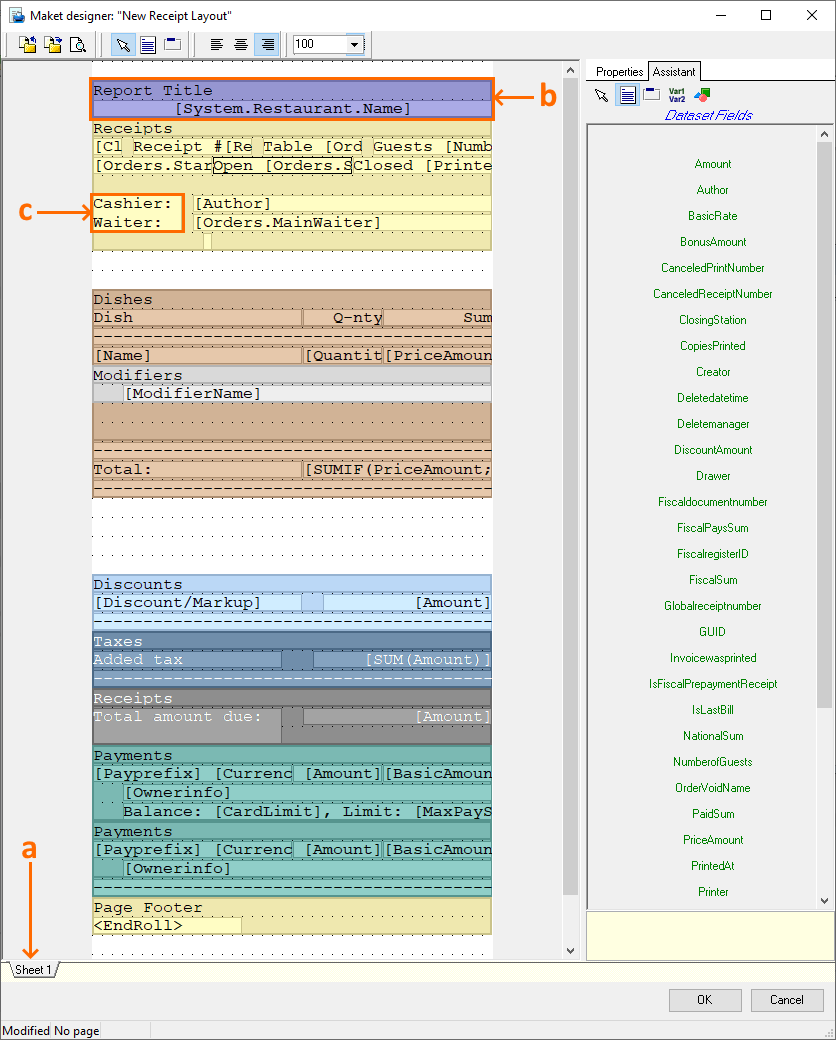
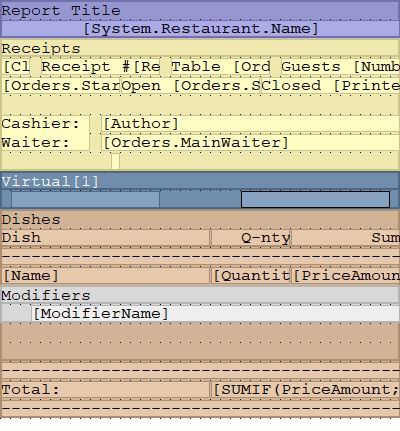
Let's take a closer look at what the check layout consists of:- A Sheet is a page on which all the receipt elements are located. Elements are shown in different colours only in the editor, the receipt is printed in black and white.
- A Band is a section with a specific dataset. Inside the band, you can operate only with data from the dataset.
- A Memo is an active element where various data can be added. You can add a simple text or a variable from a dataset. Variables areenclosed in square brackets. A memo is placed inside a band.
The sizes of bends and memos can be changed by dragging and dropping their borders. Also, you can move the band by holding it down with the left mouse button and dragging it to the desired location.
We will describe the properties of each element in more detail below.
There are two tabs on the right side of the layout editor:- Assistant — displays available datasets
- Properties — displays the properties of the selected layout element.
- Now you can go directly to editing the layout:
- Let's try to display the table name in a separate line of the receipt. To create a band, right-click on a free area and select Create band
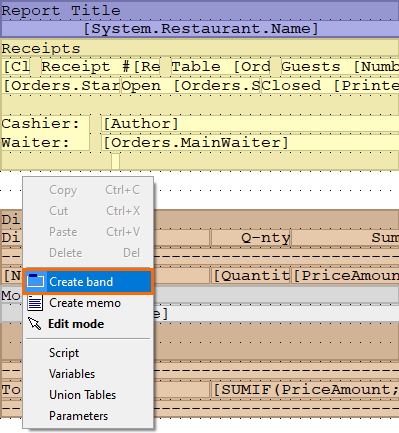
- When adding a band to a sheet, you can create an object of 5 types. What each of them serves for is clear from their names. The main band type, where data is displayed directly, is virtual.
Select Virtual Band and click Ok.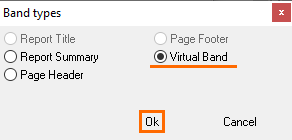
By holding down the left mouse button on the band's edge, you can move its borders. - Now, add two memos.
Right-click on the bend and select Create memo. Change its size as you wish. Repeat the same steps for the second memo.
- Now specify what data should be displayed in the memo.
Switch to the Content editor by double-clicking the left mouse button on the memo window. Then enter the text you want, for example: Table number. Click Ok.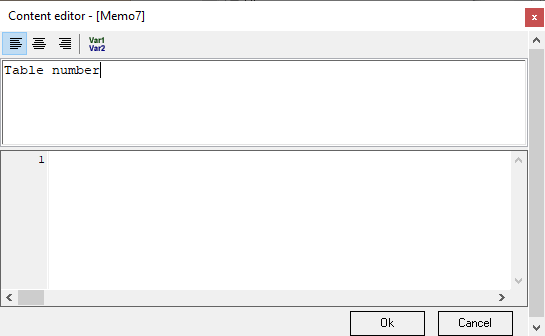
The written phrase is a constant, it will be printed on every receipt, regardless of the table name. - Add the variable to the second memo. Double-click on the memo window to open the editor. Select the
 button on the top bar. A window will open with a list of available attributes.
Go to Orders > Table > Main and click once on the Name field, then the Ok button.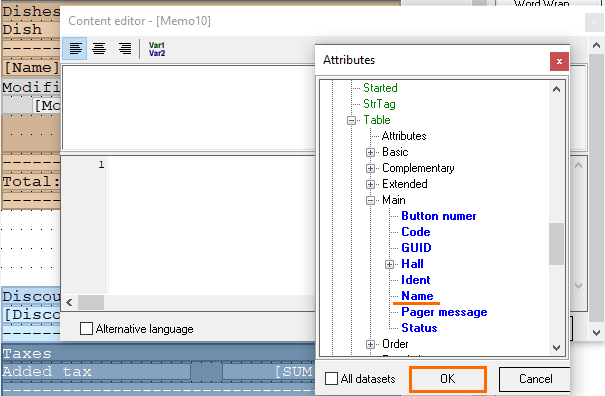
A variable with the table name will appear in the window. Click Ok again to exit the memo editor.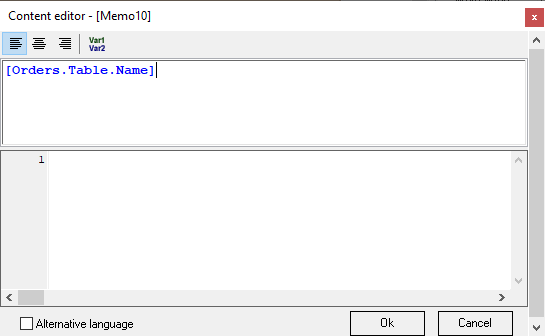
We have created a variable, and now the name of the table for which the receipt is being made will be printed in these lines.
- Click Ok in the lower right corner to close the layout editor.
- Editing the layout is complete. Now you need to apply the layout, i.e. to tell the system what layout to print. Find the instruction in the article on editing and using a layout.
Element Properties
The layout editor is equipped with a built-in script editor, which has a syntax similar to Pascal with some limitations. Scripts can be applied to a memo (the lower part of the memo editor), sheet, band, depending on where the script is placed (it affects the code triggering time): the sheet is executed first, then the band, and then the memo of this band.
Properties Common for All Elements
- Visible
To show object or not. The script is executed regardless of whether the object is visible or not. - Name
The name of the object. This name is used to access the object in scripts. - Tag
This property has no predefined purpose. Used at the discretion of layout developers in scripts. - Script
The script text. It is written in a Pascal-like language, the syntax is that of Pascal. It has no access to arrays and pointers. The script can contain local variables, which are declared at the beginning of the script using the var construction. The script has access to all layout objects — pages, bands, and memos. The script can change the properties of layout objects. The data source fields are accessed by means of the [DateSet.FieldName] construction. Each script is executed twice: the first time at the stage of the layout preliminary calculation, the second at the stage of generation. You can find out at what stage you are now using the Report.Stage variable, which takes the following values: stPrecalc (preliminary calculation), stShowing (generation).
Sheet (Document)
The report layout consists of one or more sheets. Sheets are processed and printed sequentially, independently of each other, the order of output is from left to right. Each sheet contains its own set of service bands: Report title, Header, Footer, and Report summary.
Sheet Properties
- Fixed Height
A fixed paper height. Specifies the maximum number of lines on the printed page. After reaching this number of lines, a new page will be started. In the case of a slip-on printer, a message about inserting a new sheet of paper will appear. In the case of a roller printer, the paper will be cut. - Variables
A list of variables common for all layout sheets. This editor describes the global variables of the layout. Global variables can be accessed from any layout script, in contrast to local variables, which are available only within the script where they are declared. - Parameters
A list of parameters common for all layout sheets. Datasets initially contain data for all stations, waiters, cashiers, etc. Parameters are used in order to build a report only for a specific employee. Before printing the report at the cash station, the user is asked to set values for parameters, and the report is built taking into account these restrictions. Report parameters work like filters for datasets. When developing a layout, a list of its parameters is set. Each parameter is described by the following properties:
Field name — the name of the field by which the filter will be set. All datasets will be filtered by this field. If there is no field with this name in the dataset, then the dataset is not filtered.
Collection — a reference from which values for the parameter will be selected.
Value — a fixed value for the parameter. The values are selected from the reference specified by the Collection. The parameters with the specified value are not changed when the report is printed.
- Union Tables
A list of associations common for all layout sheets. It is possible to create a table that is the union of two other tables. The resulting table has the same set of fields as the first table, and consists of rows from both the first and second tables. In one layout, you can define several unions, each of which is described by the following properties:
Name — the name of the resulting table.
Table 1 — the name of the first table.
Table 2 — the name of the second table.
- New Page
If true, then after the printing of all the page bends is completed, the paper cut command will be inserted (for roller printers only; for slip printers, this command is ignored). - Two Passes
If true, then when building the layout, the scripts are executed twice: the first time with Report.Stage = stPrecalc, the second with Report.Stage = stShowing. Two passes are needed for the script to make such report changes that will require the report regeneration. For example, when you change the grouping or sorting of the band from this band script.
Band
As mentioned above, each band has its own dataset. After creating a band, using a double click, you can bind the required dataset to it, with which you can later work within this band.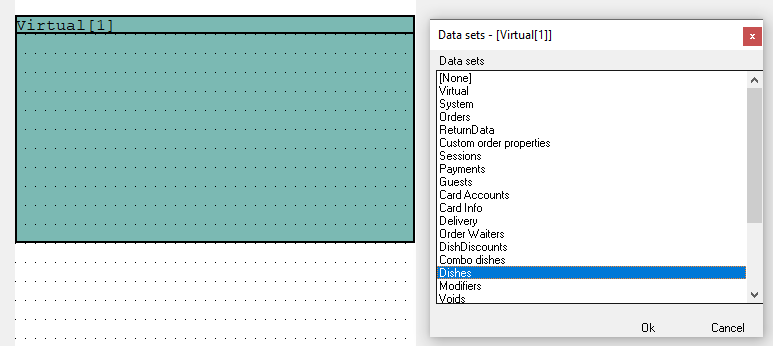
Bands are placed on sheets or nested in other bands. Bands are divided into bands with data sources and bands without data sources (service bands). Service bands include the following types:
| Report Title | Displayed once at the very beginning of the report |
| Report Summary | Displayed once at the very end of the report |
| Page Header | Displayed at the beginning of every printed page |
| Page Footer | Displayed at the end of every printed page |
The order of bands processing and printing: on each printed page, a Header is displayed at the top of the page, and a Footer at the bottom of the page. Once, on the first page, the Report Title is printed after the Header. On the final page, before the Footer, the Report summary is printed. The rest of the bands are displayed in top-down order, i.e. the topmost band will be printed first, then the second one, etc. If there are several sheets in the layout, then each of them is processed and printed as a separate layout and can contain the Title, Report Total, Headers, and Footers.
All bands, except for service bands, can contain up to 3 sections: Body, Header, and Footer. None of the sections are obligatory, but at least one of the sections must be present. The order of the band printing: first, the content of the Header is printed, then the Body is printed as many times as how much there are lines in the data source, after which the Footer content is printed.
A band can modify the content of its data source by sorting, filtering, and rearranging it. This is done by using the Filter, Group, and Sort properties. The order of properties processing: first, a filter is applied to the data source — a band filter and a filter based on the report parameters — and after that the resulting data source is grouped and then sorted.
Band Properties
- DataSet Name
The data source linked with the band - Filter
The script text, used to apply the filter to the data source. It is written in a pascal-like language. The script is applied to every line of the data source. The essence of the script is to set the Filter variable to true for those rows of the data source that should remain in the final dataset. Example: Filter: = ([Exclude Income] = 1). Only those rows will remain in the data source where the Excl.Income field was 1. - Sort Order
The set of fields by which the sorting of the data source linked with the band is performed - Grouping
Grouping specifies the set of fields by which the original data source is grouped. Summation is performed for the rest of the fields, i.e. aggregates are counted.
Example: let's say we have a Payment data source:
| Currency Group | Currency | Order | Guests | Sum | Nat. Sum |
| Cash | Rubles | 1/2 | 2 | 300 | 300 |
| Cash | Euro | 1/3 | 3 | 20 | 700 |
| Credit cards | Master card | 1/4 | 5 | 100 | 100 |
| Cash | Rubles | 1/5 | 2 | 500 | 500 |
| Cash | Rubles | 1/2 | 2 | 200 | 200 |
If we group it by the Currency Group field, the result will be as follows:
| Cash | Rubles, Euro | 1/2,1/3,1/5,1/2 | 9 | 1020 | 1700 |
| Credit cards | Master card | 1/4 | 5 | 100 | 100 |
If we group by the Currency Group, Currency fields, the result will be as follows:
| Cash | Rubles | 1/2,1/5,1/2 | 6 | 1000 | 1000 |
| Cash | Euro | 1/3 | 3 | 20 | 700 |
| Credit cards | Master card | 1/4 | 5 | 100 | 100 |
As you can see from the example, the totals were calculated for the numeric fields, the row fields were joined. In this example, we have calculated national amounts by currency groups and by currencies. Note that the total for the Number of guests was calculated incorrectly because the source data contains several records for one order. For the rest of the fields, the total is meaningless.
You can also calculate the total using aggregate (sum) fields. There are three types of aggregate fields:
- SUM(Field) — Analogue of SUM(Field) in SQL. Allows calculating the total for the Field field. The total is calculated from the original dataset, which was before the grouping but using all filters. In our example, the [SUM (Nat sum)] aggregate will be calculated as 1700, the [SUM (Sum)] aggregate will be calculated as 1020.
- COUNT(Field) — Analogue of COUNT(DISTINCT Field) in SQL. Allows counting the number of unique values for the6 field. For example, [COUNT(Currency)] will return 3 because there are three currencies in the Payment data source.
- SUM(Field1, Field2) — has no analogue in SQL. Combines grouping and counting totals. It works in the following way: the source dataset is grouped by the fields Field1, Field2, after which the total is calculated by Field2. For example, you need to calculate the number of guests for all orders, then [SUM (Order, Guests)] will return the correctly calculated total = 12, while a simple summation of the Guests column will give 14.
The same aggregates can be calculated with a given condition:
- SUMIF(Field; Condition) — Analogue of SUMIF in Excel. Allows calculating the total for the Field field for those lines where the Condition condition is met. A condition is an expression of the FieldName = Value form. Instead of the = (equal) operator, you can use any comparison operator: >, <, <=,> =, <>. In our example, the [SUMIF(Nat.Sum; Currency Group = Cash)] aggregate is calculated as 1600, the [SUMIF(Sum; Currency Group = Cash)] aggregate is calculated as 920.
- COUNTIF(Field; Condition) — the same as COUNT(Field1), but only for those dataset lines for which the Condition, which looks like FieldName = Value, is met. For example, [COUNTIF(Currency; Currency Group = Cash)] will return 2 because the Payment data source uses two cash currencies.
- SUMIF(Field1, Field2; Condition) — the same as SUM(Field1, Field2), but only for those dataset lines for which the Condition having the form FieldName = Value is met. For example, you need to calculate the number of guests for all orders with cash payment, then [SUMIF(Order, Guests; Currency Group = Cash)] will return 7.
Category
Any field of the data source can act as a category. The category is processed as follows: first, unique values are determined for the specified field, then a band is printed for each received value. Each time a band is printed, a filter of the type Category = Value is applied to the data source. For example, if you specify Currency Group as the category, then the Payment data source will be printed as follows:Currency
Order
Guests
Sum
Nat. Sum
Credit cards
Master card
1/4
5
100
100
Cash
Rubles
1/2
2
300
300
Euro
1/3
3
20
700
Rubles
1/5
2
500
500
Rubles
1/2
2
200
200
- Calculated Fields
Using this property, you can add calculated fields to the band dataset. You need to add calculated fields in order to group or sort by fields that are not present in the dataset but can be calculated based on its fields. Each calculated field is described by the following properties:
Expression — an expression itself. At the moment, attributes can be used as expressions, for example, Employee.Code or MenuElement.Weight.
Field Name — the system name of the added field. Set in English, needed for using this field in scripts.
Title — a custom name of the added field.
Header
A band header. Is printed first. It is characterized by the following properties:Colored
Printing the header and footer contents with color highlighting. Works if the printer supports inversion printing
Double Height
Double print height of header and footer content
Double Width
Double print width of the header and footer content
Show Empty Lines
The flag determines whether to print empty lines or not
Size
Header/footer height in lines. If 0, no section is printed
- Body
A band body, displayed after printing the Header. The content of the band body is printed as many times as how many records the dataset contains. Band body properties are the same as header properties. - Footer
A band footer, displayed after the Header and Body of the band. The properties of the footer are the same as those of the header. - Behavior — Show Empty
A flag indicating whether to display a band if there are no records in the data source linked with the band. By default, such bands are not displayed, even if they have a Header or Footer set. - Before Start
A script that is executed before starting band processing. - After Finish
A script that is executed after the end of band processing. - Script
A script that is executed for each line of the data source, just before printing it. - XML Section
Used to export a printed document to XML. When exporting, the lines generated by this band will go to the section with the specified name. By default, the section name is the same as the data source name.
Memo
In the memo, separate fields of the data source or any text can be displayed. Data source field names (variables) are enclosed in square brackets.
After the dataset is tied to the band, a memo can be placed inside this band. Variables from the dataset are inserted inside these memo, so the required dataset will be printed in the report.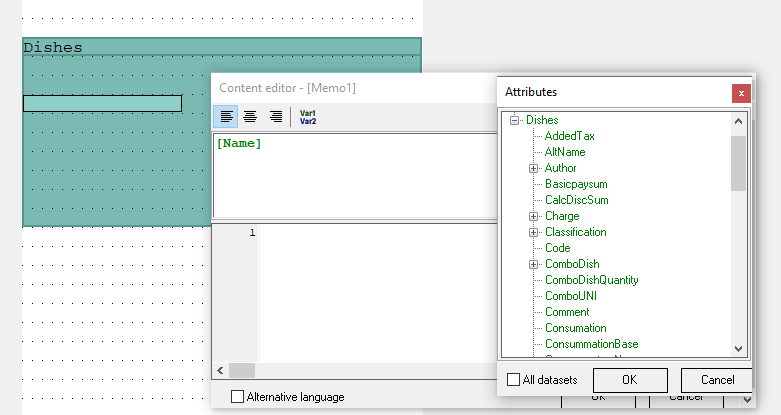
It is important to understand that variables from a dataset can only be used within its own band.
Memo Properties
- Alignment
Specifies whether the text is aligned left, right, or centered. - Content
Contains the text to be printed. To print fields from a data source, the field names must be enclosed in square brackets: [FieldName]. To print a field from another data source that is not linked to the band in which the memo is placed, you need to use the [DataSourceName.FieldName] construction. To print escape sequences, you need to use the <EscapeCommand> construct. The list of escape commands will be given below. The number of fields that can be displayed using one memo is not limited. - Format
Specifies the variable format (number, date, time, other). - Hide zeros
- Alternative language
- Word wrap
Enable auto-wrap. - XML Attributes
XML class
XML tag
Filter Setting Example
Let's assume that you need to set up filtering of the Dish in the bill by category. It should look something like this:
[Classification]

                                  [Category1]

                                                             Dish1
                                                             Dish2
                                                             Dish3

       Total for category: [priceamount]

                                   [Категория2]

                                                            Dish4
                                                            Dish5
                                                            Dish6

        Total for category: [priceamount]

Total for classification
Solution:
- Add a calculated field with the required classification to the dish band (f.ex., the Category field)
- Set Category = Category for the band
- Group the band by the Category field
- Add another band of dishes to the band
- Add the same calculated field to the nested band and set the same grouping
- The field for displaying the dish name must be added to the nested band, the field for the category name — to the external one.